Introduction
The FastClimate model is a highly simplified climate model to demonstrate the main components of the climate system. It incorporates simple parameterizations of the effects of CO2 concentration, longwave and shortwave radiative processes, surface reflectivity, the strength of horizontal advective transport in both atmosphere and ocean, the extent and thickness of sea-ice, and the depth of the ocean surface mixed layer. Water vapour and clouds are not included explicitly, but their effects are included implicitly within the parameterizations. The physical processes are expressed as zonal averages over 18 latitudinal bands.
The initial conditions and the strength of the various phyiscal processes can be adjusted from the model setup page. When the setup form is submitted the model is run and the results are automatically plotted as a set of figures showing the intensity of incoming solar radiation, surface temperature, and ice thickness with latitude and time of year; and comparisons with a standard case that represents the current climate state. The default values of model parameters are those for the reference case. The figures are returned via a web page. Note that contour plots of differences between the current run and standard case will appear blank if you run the model with the default conditions.
FastClimate Reference Case
The results returned by the FastClimate model are compared with those for a reference case in which the model parameters represent current conditions. The reference case was run for a 35 year period and the data saved. When a new model run is made for any period up to 35 years, the reference data for the period for which figures are to be generated is loaded for comparison with the new results. Plots of surface temperature and ice thickness for the last 15 years of the reference case are shown below.
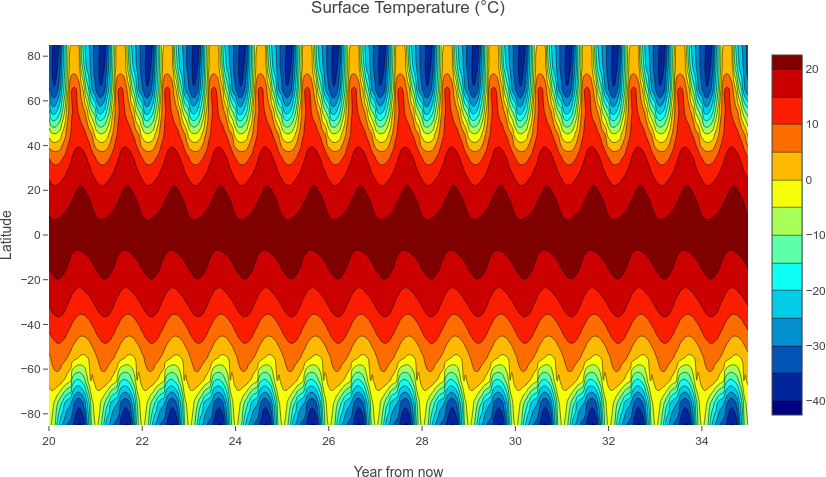
Figure 1. The surface temperature for the last 15 years of the 35-year standard case.
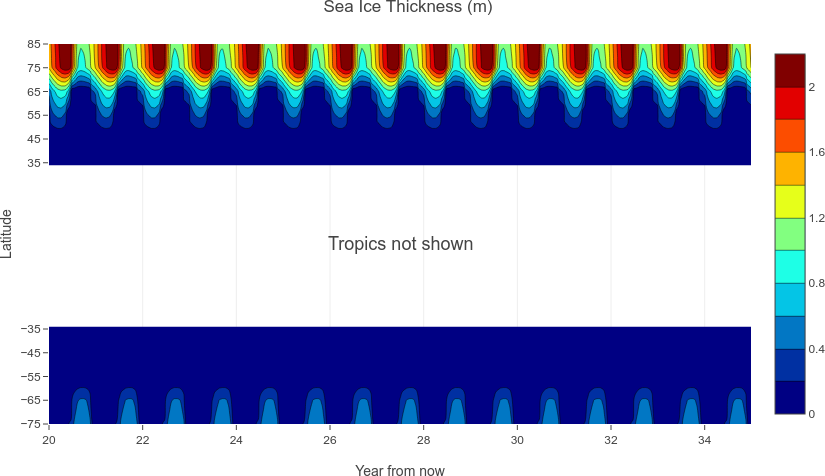
Figure 2. The sea-ice thickness for the last 15 years of the 35-year standard case.
When interpreting some of the results you should keep in mind that the distribution of land and ocean is very different for the northern and sothern hemispheres. The figure below shows the percentage of the surface covered by ocean as a function of latitude.
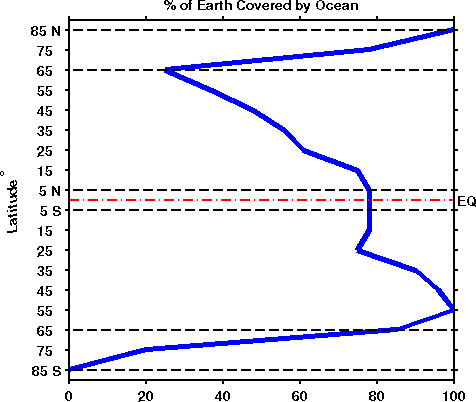
Figure 3. The zonal average fraction of the surface covered by ocean.
Assessed Exercise
Full details of the assessed exercise can be obtained as a PDF document.
About The Model
The FastClimate model is used here by kind permission of its author Dr Peter Guest of the Meteorology Department at the Naval Postgraduate School in Monterey, California. It was originally written in the MATLAB programming language, and developed by Dr Ian Brooks at the University of Leeds.